The VisualVM tools can help you detect memory leaks in progress as well as other constraints on your server before it crashes. But even after a crash these tools are helpful. The tools are very graphical and easier to use than attempting to read thread dumps and heap dumps manually.
Here are some simple steps to use this great tool set with ColdFusion.
1) download java jdk 1.6.09 or later
http://java.sun.com/javase/downloads/index.jsp
2) Download Visual VM
https://visualvm.dev.java.net/
3) Configure Coldfusion jmx access
Best way is to go to Coldfusion Administrator Java and JVM settings section.
Add the following parameters:
-Dcom.sun.management.jmxremote.port=8701
-Dcom.sun.management.jmxremote.ssl=false
-Dcom.sun.management.jmxremote.authenticate=false

You can decide whether to use ssl or not, and also on the port to use. If you want to use jmx authentication I would recommend you read:
http://java.sun.com/javase/6/docs/technotes/guides/management/agent.html#gdenl
4) Configure your Visual vm start up to point to your jdk if you have not set environmental variables:
e.g. on Windows
if you extracted the visualvm files into C:\Java\visualvm_122
and
Your JDK is located in C:\Java\jdk1.6.0_19
then you can use the following command line:
C:\Java\visualvm_122\bin\visualvm.exe --jdkhome "C:\Java\jdk1.6.0_19"
I put it in a batch file that I can start easily.
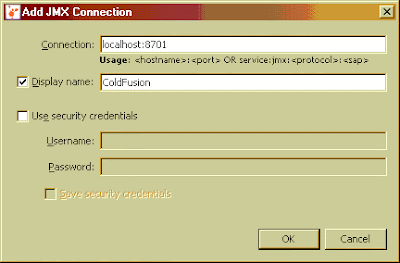
5) Start up the VisualVM tool (it may have to go through calibration first, simply acknowledge), then, and establish a connection a JMX connection by right clicking on the local node and choosing "Add JMX Connection..."
6) Add connection parameters
Now you should be able monitor your server as it runs. I found this to be more stable than the Server Monitor in Enterprise versions of ColdFusion especially under load. It does not have all the same information but you can get a detailed breakdown of VM memory use.
To get into the details of which CF code is using memory you have to generate a heap dump and use the heap walker to run the analysis. All the classes starting with cf... are your code running on the VM.

You also have the option to monitor remote ColdFusion servers as well. You monitor multiple remote and local CF instances in one console, however, unlike the local monitoring, you cannot generate a heap dump when using remote connections.
Creating a remote connection involves two steps in VisualVM after you enabled jmx access on ColdFusion.
a) Adding a remote host. You do that by right clicking on the "Remote" node in VisualVM
b) Specify the host name and display name and connection jstatd port (this is the same port you set in your CF JVM start up parameters). You will need to use the Advanced Settings dialog to do this. The port should be the same you set in the ColdFusion Java and JVM settings for that instance of CF.
c) Set up a remote JMX connection by right clicking on the server name node and choosing "Add JMX Connection...". This will bring up a similar window as in step 6 above. Fill in the server and port information and you should be able to see your server.
Another common use for the VisualVM tool is analyse a Heap Dump after a VM crashes due to memory problems. You can open and walk through the final VM Heap state. To make ColdFusion produce a heap dump you will have to change the jrun.config file and add this config option:
-XX:+HeapDumpOnOutOfMemoryError
If there is a crash the heap dump should be a text file located in your {coldfusion}\bin folder.
More information on how to use the VisualVM tool is available on the VisualVM website; definitely worth a look.
Cheers,
-B.


5 comments:
You can update the VisualVM config file to always use the JDK 6u19. Just add the --jdkhome parameter to 'default_options' section of C:\Java\visualvm_122\etc\visualvm.conf.
Another possibility to run VisualVM using JDK 6u19 is to run the Java VisualVM included in JDK 6u19: C:\Java\jdk1.6.0_19\bin\jvisualvm.exe. JDK 6u19 bundles VisualVM 1.2.1 according to https://visualvm.dev.java.net/releases.html.
FYI, the steps for monitoring remote CF server using JMX should be the same as for the local server. The jstatd connection is unrelated, it only needs to be configured when running the jstatd (http://java.sun.com/javase/6/docs/technotes/tools/share/jstatd.html) daemon on the remote host. It can be used as an alternative to the JMX connections, it allows the VisualVM to discover/connect to remote applications without any special setup.
This is great info except that you shouldn't leave authentication set to false. This configuration is insecure: any remote user who knows (or guesses) your JMX port number and host name will be able monitor and control your Java application and platform. You will need to setup a jmxremote.password file and set the authentication to true. More can be found at http://download.oracle.com/javase/1.5.0/docs/guide/management/agent.html
I'm on 64-bit Windows 2008 R2 with CF9, which is also 64-bit. Whenever I tried using VisualVM JMX to connect to my server, I got the error "cannot take heap dump".
So the fix in my case, was to stop the ColdFusion service, and open up a command prompt. CD to the ColdFusion9\bin directory, and run the script called "cfstart.bat". Run it and leave the window open.
Restart VisualVM, and the pid for JRUN shows up inside of VisualVM, and I can take heap dumps. Hope this helps someone.
Awesome Artical Really i have searching this type of valuable information From a lot of days i found satisfaction when Read your blog Thanks for giving this type blog and also please Read link bvba Woodstone which provide information monitoring tools
Post a Comment